Back to the index · Previous: Audit trail columns
How it works#
Three places tell you what ran. DataBridge has its own Load History with every job, table, phase and row count, a View Logs window for the service log, and a per-job log. The workspace screens History, Log and Lineage show notebook runs, schedules, pipelines and, since every DataBridge job reports back to the application, the loads as well, so a load sits next to the notebook runs that read from it. Administration → Ingestion Jobs is the operator's view of a job: attempts, memory during the job, crash history, log lines, and the buttons to start the same job again or re-apply Bronze. Recovery rests on the formats: Delta keeps a version per write and can be restored to one, Iceberg keeps snapshots and can roll back to one, and every DataBridge position is advanced only after a successful write, so a failed run is simply run again.
Load History#
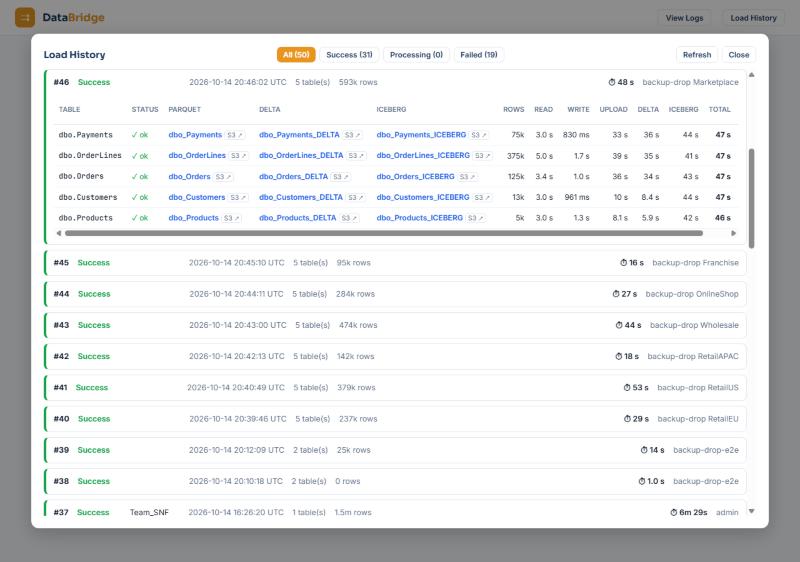
Databridge → Load History (top right): every run with its tables, formats, rows and time split (read, write, upload, Delta, Iceberg). Per table: Match, Merged, Mismatch (source and lake differ; run again), an error with its reason, or No result: the worker stopped before this table finished. Running jobs: Stop job, and a stop link per table (the table is marked stopped, the rest continue). The Schedules panel at the top: Pause, Run now, Delete. The job result (GET /api/databridge/api/jobs/<id>) carries status, per-table results, cdc_changes, cdc_lsn_before / cdc_lsn_after, apply_changes and kafka.
Memory guard and streamed retry#
A DataBridge job runs in a worker process watched against the container's memory limit. When the guard trips, the worker exits instead of being killed mid-write; tables that were running in memory are queued again as streamed (read and written in parts) for up to three attempts and up to three crashes per job, and the job continues. A table that cannot be streamed (incremental, change-log and non-S3 loads) fails with that reason; a table that was already streamed fails with a hint to lower the memory budget or read fewer partitions at once. Position of change logs and topics is untouched by a crash. The Ingestion Jobs page shows each attempt and the memory curve.
View Logs and the per-job log#
Databridge → View Logs opens the service log of every job, with a text filter. The per-job log is GET /api/databridge/api/jobs/<id>/log, also shown at the bottom of the job in Ingestion Jobs; lines of the form job 74 | dbo.Orders | … name the table and phase, | memory | lines the guard.
Ingestion Jobs#
Administration → Ingestion Jobs: the job list with strategy per table (in-memory, streamed, bulk), attempts, Worker process / Whole container / Container limit memory, a Memory during the job chart, The job stopped with an error with the reason, Earlier attempt history, the log, Start a new job with the same settings and Retry Bronze (apply this job's loaded tables to Bronze again).
History, Log, Lineage#
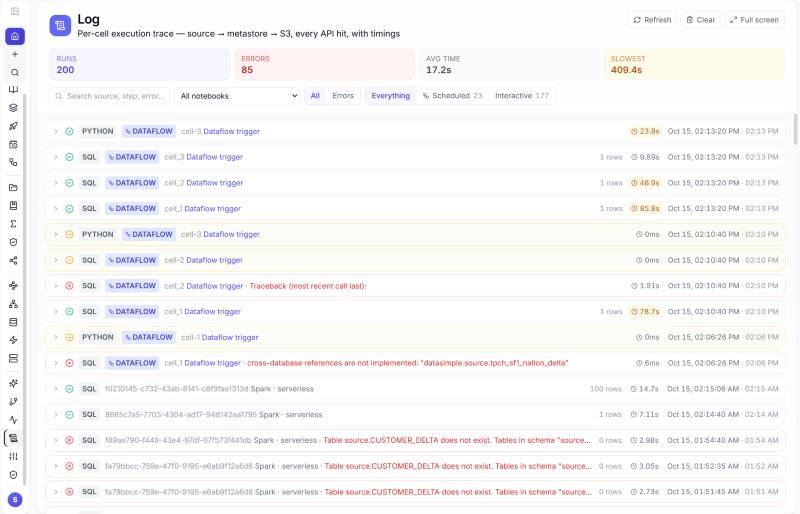
| Screen | Notebooks and pipelines | DataBridge |
|---|---|---|
| History | every action: notebook created, run, scheduled, deployed, deleted, agent actions, with the outcome; a user sees their own rows, administrators the tenant | one line per job (filter DataBridge): who ran it, source name, table count, OK / Failed; expand for rows, formats, Bronze rows and Silver +inserted ~updated -deleted per table |
| Log | one line per cell run: source, steps, status, duration, rows, error text; filters notebook, errors, origin (interactive, scheduled, Dataflow); click to open the notebook at that cell | one line per job, DataBridge load · <source> · N tables, with total rows, duration and status; expand for the per-table trace |
| Lineage | table and column edges from save_table, merge_delta, ds.* and SQL writes; impact mode |
the source system as an external node feeding the lake copies, Bronze and Silver; a table with no producing notebook says Loaded by DataBridge job #N |
Also: Schedules → Manage (one job's run list), Pipelines → open a pipeline (the run list with every step and its logs), the notebook menu Audit log… (one notebook's timeline), Administration → Governance → UC Audit (every grant, revoke, filter, mask, drop with actor and time), Administration → Activity Logs / Error Logs.
GET /api/notebooks/activity?group=run&limit=100
GET /api/notebooks/run-log?notebookId=12&limit=50
GET /api/notebooks/12/timeline?limit=300
GET /api/notebooks/unity-catalog/audit?limit=100
GET /api/databridge/api/jobs?limit=20
Usage#
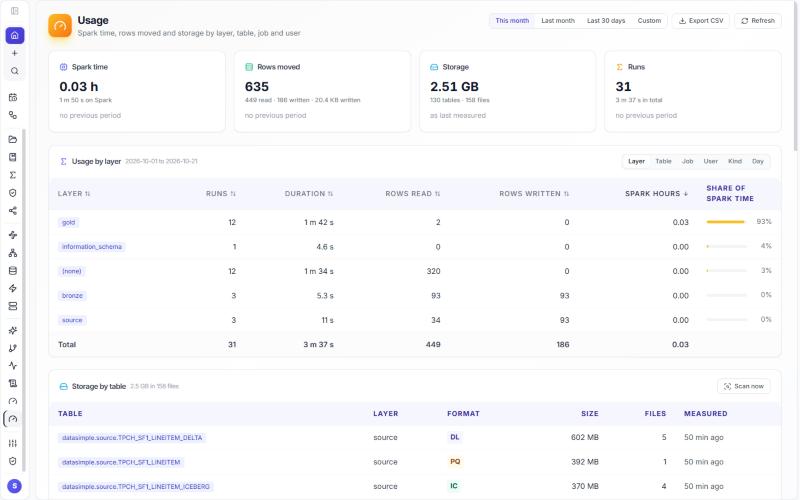
Monitoring → Usage shows how much work your tenant ran and how much it stores, for any period, compared with the period before. It shows measured units only. Amounts of money are not shown, because the application does not read the cloud bill and an estimate would not be accurate.
What is measured. Every unit of work leaves one row in the usage ledger when it finishes:
| Kind | Written by | Carries |
|---|---|---|
| DataBridge job | DataBridge, per table | rows read and written, bytes written, cluster seconds |
| Bronze apply, Silver apply | DataBridge | rows applied; cluster seconds |
| Notebook cell | editor, schedules, pipelines | duration, rows, the table it wrote (catalog name), Spark seconds |
| Pipeline step, schedule run, Dataflow run | the runner | duration and status, for grouping (their cells carry the Spark time) |
| Storage scan | nightly at 03:30 UTC, or Scan now | bytes and files per registered table |
Spark time for a notebook cell is the cell's run time on Spark; it is a measure of the work, not of what the cluster costs.
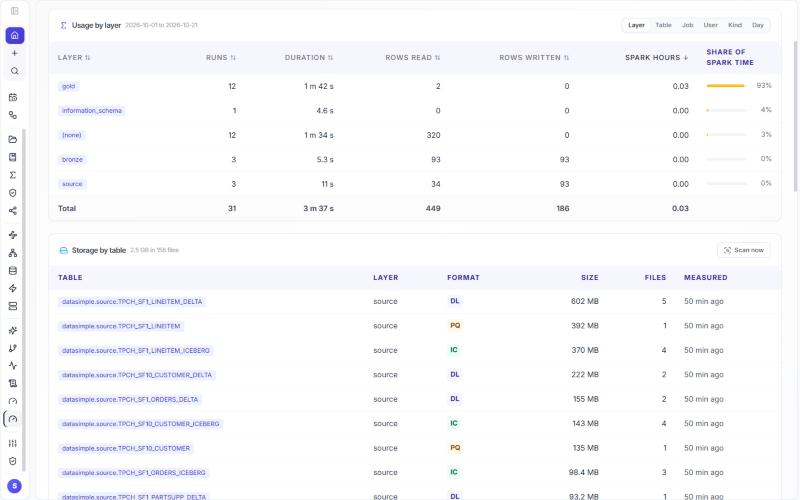
The screen. Cards for Spark time, rows moved, storage and runs, each with the change against the previous period; one table grouped by layer, table, job, user, kind or day, with each row's share of the Spark time; the largest tables by size (Show all for the rest); the recent ledger with a kind filter; Export CSV.
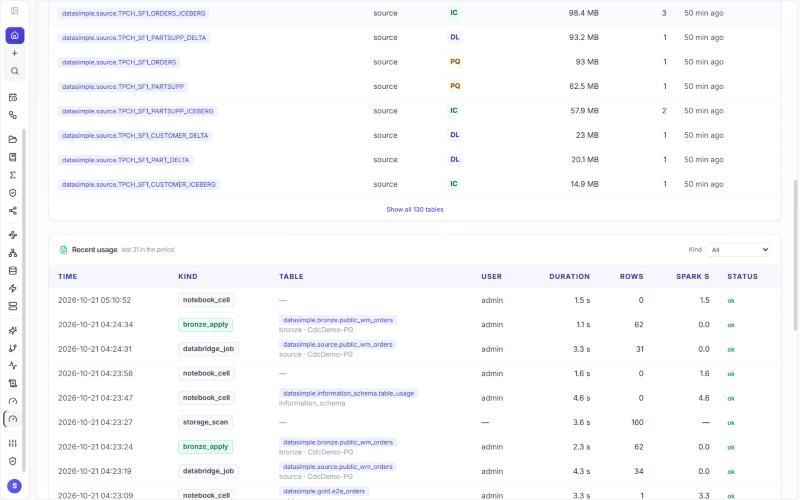
From SQL and Python. The same numbers are two Unity Catalog views (see chapter 9). A cell that reads information_schema holds one statement, so each query goes in its own cell:
SELECT kind, count(*) AS runs, round(sum(spark_seconds) / 3600, 2) AS spark_hours
  FROM datasimple.information_schema.usage
 WHERE started_at >= current_date - INTERVAL '30 days'
 GROUP BY kind;
SELECT table_name, bytes, runs_30d, rows_written_30d, spark_seconds_30d
  FROM datasimple.information_schema.table_usage
 ORDER BY bytes DESC;
u = ds.usage(days=30)                              # the ledger, this tenant
t = read_table("information_schema.table_usage")   # size and recent work per table
Rows are limited to your tenant, and table names are catalog names only.
Sessions#
A signed-in session ends after 60 minutes without activity (SESSION_IDLE_MINUTES to change it). Clicks, typing and scrolling count; a screen that only refreshes itself in the background does not. One minute before the limit the screen shows a countdown; afterwards the sign-in page says the session ended for inactivity. Signing in from a second browser ends the first session, and the absolute life of a session is 24 hours.
Recovery#
A Delta table: see, read and restore a version#
DESCRIBE HISTORY datasimple.silver.orders;                             -- version, timestamp, operation (WRITE, MERGE, RESTORE…)
SELECT * FROM datasimple.silver.orders VERSION AS OF 3;                -- read an older version
SELECT * FROM datasimple.silver.orders TIMESTAMP AS OF '2026-10-16 18:00:00';
RESTORE TABLE datasimple.silver.orders TO VERSION AS OF 3;             -- the table is that version again; the restore is a new version
list_delta_history("silver.orders")                                    # the same history as rows
old = read_delta_at("silver.orders", version=3)                        # or timestamp="2026-10-16 18:00:00"
save_table(old, "silver.orders")                                       # or keep it beside: save_table(old, "silver.orders_v3")
RESTORE writes a new version with operation RESTORE, so a restore can itself be undone with another restore. A dropped table is a soft drop: UNDROP TABLE datasimple.silver.orders brings it back unless it was dropped with PURGE.
An Iceberg table: snapshots and rollback#
Registered Iceberg copies are addressed as iceberg.<layer>.<table>; in a SQL cell the catalog name datasimple.<layer>.<table>_ICEBERG is routed there automatically.
SELECT snapshot_id, operation, committed_at FROM iceberg.source.dbo_Orders_ICEBERG.snapshots;
SELECT * FROM iceberg.source.dbo_Orders_ICEBERG VERSION AS OF 6318412349011;          -- a snapshot id
CALL iceberg.system.rollback_to_snapshot('source.dbo_Orders_ICEBERG', 6318412349011);  -- the table is that snapshot again
Re-running a load#
| Source | To replay | What happens |
|---|---|---|
| Watermark run | run once with Full load every run | the copies are rebuilt, keys missing from the snapshot become deletes, the watermark is re-based |
| Change-log CDC (SQL Server, PostgreSQL) | run once with Full load every run, then switch back | a full snapshot re-bases the position __cdc_lsn (PostgreSQL: a missing slot is re-created); required after CDC history no longer covers the last position or Replication slot … lost WAL |
| Kafka | ask an administrator to clear the topic's stored __kafka_offsets and run with Start from = earliest; or load under a new Source Name |
the topic is read from the beginning (new Source Name: into a fresh folder and fresh catalog names); messages older than the topic's retention are gone (skipped_expired) |
| File drop | drop the files again under a new name, or re-drop the same file with changed content (new ETag), or load under a new Source Name | already-loaded files are skipped by design (No new files since the last run) |
| Backup drop | drop a new backup file, run again | a new snapshot, merged by key |
Start a new job with the same settings on the Ingestion Jobs page, or Run now on the schedule, starts the same load.
Re-applying Bronze and Silver#
Both are idempotent by sequence. Retry Bronze (Ingestion Jobs) or Bronze CDC → Selected Tables applies the job's tables to Bronze again; re-applying the same batch leaves one row per key as before. Silver's MERGE only acts when the incoming __seq (or __sequence) is newer, so running the same batch, cell or APPLY CHANGES INTO again changes nothing; a Silver failure leaves the position where it was and the next run re-reads and re-applies the same changes.
What a failed run leaves behind#
- The position (
__cdc_lsn,__kafka_offsets, the watermark, the file ledger) is not advanced; the next run reads the same changes again. - Copies written before the failure stay (a Delta copy shows the version; the table reports an error in Load History).
- With the Spark box, the change batch staged for the Silver MERGE under
_changes/…is kept for the retry and removed after a successful merge. - A table stopped by hand is marked stopped; a worker crash leaves No result: the worker stopped before this table finished and a crash entry in Ingestion Jobs.
- History and Log receive
databridge.job_failed/ a failed line, with the error text.
Read more#
- Delta time travel and restore: https://docs.delta.io/latest/delta-batch.html#query-an-older-snapshot-of-a-table-time-travel · Iceberg Spark procedures: https://iceberg.apache.org/docs/latest/spark-procedures/
- DataBridge in History, Log and Lineage: DataBridge guide; troubleshooting tables: change-log CDC, Kafka, when something does not work.